NoGA
NoGA project (SIDN fonds)
Log generation and replay
by Marnix Dessing
Access log replay
A problem for comparing statistics between web analytics tools is generating enough traffic to get meaningful differences. While results from a live site can be used, it is hard to know the accuracy of the statistics based on the actual traffic as it is live and comes from many sources. Access logs can be used to calculate the statistics manually. However doing so on a live environment makes it hard to get repeatable tests. Constructing repeatable and isolated tests using a benchmark is therefore a good practice.
Architecture
In the diagram below the log replay architecture is presented. We will use Matomo and Google Analytics as our two web analytics tools receiving the same requests at the same time.
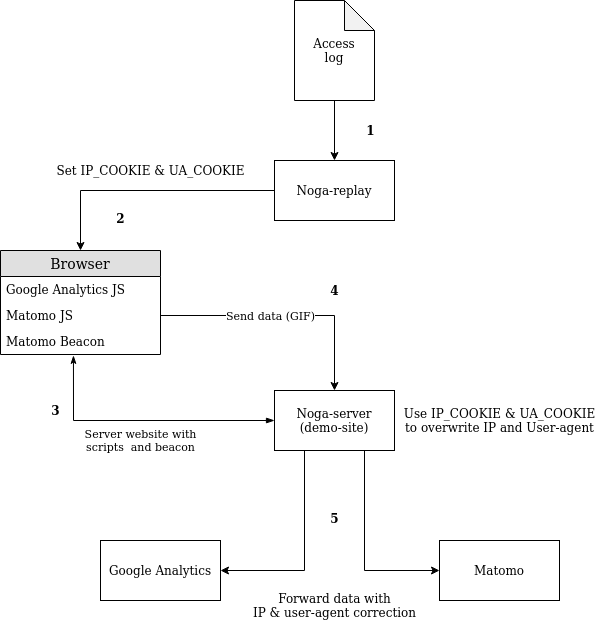
- The access log is read by the Noga-replay script.
- The logs are parsed.
- Non GET requests are filtered out.
- The IP and User-agent are placed in a cookie en send to the Selenium driven browser.
- The URL is requested.
- After the request cookies are extracted and stored for other requests from that IP & User-agent combination.
- The next log line is processed.
- The browser requests the demo site on the path extracted from the access log with the cookies from in step 1.
- The Noga-server serves a webpage containing the JavaScript and/or web beacon trackers.
- The trackers work there magic and send a GIF request back to their corresponding backend.
- This backend is replaced by dedicated noga-server endpoints, these extract the IP and User-agent from the cookies set by the noga-replay script and place them in:
- The IP in the uip url parameter, for Google Analytics
- The IP in the X-FORWARDED-FOR header, for Matomo
- The User-agent header is overwritten with the User-agent value from the cookie for both analytics tools.
- This backend is replaced by dedicated noga-server endpoints, these extract the IP and User-agent from the cookies set by the noga-replay script and place them in:
- The request is send to the web analytic tool’s backend.
Timing
The timing of each request in the access log is implemented as a delay between requests. This means the replay of logs can be speedup or slowed down as desired. However it must be noted that each requests takes time. When a request should be fired but the previous request is not finished the request will be queued (FIFO). When a larger delay between requests occurs the replay will catch up.
Limitations
By replaying the log and not using actual traffic some limitations arise. Below some are discussed:
- Only Http GET requests, processing of POST parameters is not implemented.
- No file downloads, the noga-replay script is not able to distinguish the difference between a file download URL or a web page.
- The time spend on the last page or the exiting of the site cannot be determined. (External links or other exit events cannot be captured).
- No click heatmaps and other advanced user tracking tools.
- Only one window size is used (800x600)
- Some device information is not detectable from just the User-agent.
The most important imitation however is that refferer headers are not forwarded, this remains to be implemented. Some information such as page URL when using a web-beacon tracker is not tracked due to this missing header.
Possible tests
Some tests that can be done facilitated by the log replay solution:
- Matomo’s Beacon tracking vs JavaScript tracking
- Matomo’s log importation vs actual request replay.
- Matomo’s Bot detection based on the User-agent.
- Differences between Google Analytics and Matomo
- Use of a cookie vs use of fingerprints only.
Most tests could also be performed with live traffic. However by replaying the log it is possible to repeat the tests or develop a benchmark. Also manual analytics using other tools on the log can be used to verify results.
Access log generation
Good access logs are hard to obtain. So feeding the log-replay mechanism with synthetic access logs, generated by a simple script is a good option. This section tries to explain how a simple access log generation script is implemented for usage with the log replay mechanism above.
Users
To generate an access log sessions have to be created. A session consists of a user who has an IP address and a User-agent. The IP and User-agent combination defines the user’s fingerprint. This is based on the fingerprinting techniques used by the web analytics tools.
IP address
An IP address is generated based on the format: (1-255).(1-255).(1-255).(1-255) Where each number is random generated.
User-agent
The user agent is selected from a list of different user-agents. This list consists of user-agents of different:
- Operating systems
- Devices
- Browsers
Actions
Now that we have defined a user, we need to look at the actions that make up an access log.
We distinguish three actions:
- A new user is created and enters the site on a page.
- An existing user leaves the site.
- An existing user navigates to another page.
New user
A random user is generated and added to the user-store. The IP and User-agent are stored together with an initial page. And a request is written to the access log.
Leaving user
A random user is removed from the user-store. Nothing is written to the access log.
Navigating user
A random user is picked from the store:
- The location of the user is updated with a new location. Navigational probabilities will be explained below.
- The new request is written to the access log.
Site graph
The site graph used for navigation is a site map taken (from an existing site) and therefore the graph is a tree. Construction and usage of user behavior models is a large research field. In their most basic form often Markov-chains such as in [2], [3] and [4]. Even before there were websites [1].
Initial page
The initial page of a user is a random node within the graph.
Navigation
A user moves up or down in the tree with a probability of:
- Up: 0.4
- Down: 1 - Up
When navigating down on a node with multiple successors, the probability is equally distributed.
Interval
The time interval between each action is randomized by a normal distribution and always > 0.
References
[1] Calzarossa, Maria, Raymond Marie, and Kishor S. Trivedi. “System performance with user behavior graphs.” Performance Evaluation 11.3 (1990): 155-164.
[2] Sarukkai, Ramesh R. “Link prediction and path analysis using Markov chains.” Computer Networks 33.1-6 (2000): 377-386.
[3] Dongshan, Xing, and Shen Junyi. “A new markov model for web access prediction.” Computing in Science & Engineering 4.6 (2002): 34-39.
[4] Sen, Rituparna, and Mark H. Hansen. “Predicting Web users’ next access based on log data.” Journal of Computational and Graphical Statistics 12.1 (2003): 143-155.
tags: NoGA - "Web - analytics"